# Mapping catalog
The catalog activity allows to visualise and interact with data on a digital map. Driven by today's most advanced web technologies, it enables tracking of geospatial assets in real-time.
Note
This feature requires a specific subscription, it will not be available otherwise.
👉 You own an organisation ? How to subscribe
# Key concepts
Here is a quick rundown of the key concepts to handle when you're just getting started with mapping.
The map can contain a basemap (i.e. a background context), a set of data layers (i.e. business specific data), and has an extent (i.e. the part of the Earth currently on the screen), and navigation tools to pan and zoom. A layer specifies how a geographic dataset is portrayed on the map. The final rendering supporting your use case can usually be assembled by adding a serie of layers.
A feature layer is a grouping of similar geographic elements, for example, buildings, cities, roads, earthquake epicenters, etc. Features can be points, lines, or polygons (areas). Feature layers are most appropriate for visualizing your own data on top of your basemaps. Using the catalog activity you can view, save, edit and analyze your own features and their attributes. Moreover, you can include interactive pop-up windows with information about the features.
The activity manages both space and time information in order to visualize time-varying geospatial phenomena: tracking of moving objects, history of measures taken by a sensor, weather prediction over time, etc. When a layer displays a time-varying dataset you are able to navigate back and forward in time using a timeline to see the data at your requested date/time.
# Data
The catalog comes with a set of built-in geospatial data. However, you can complete it with your own spatial data.
# OpenStreetMap
OpenStreetMap (opens new window) is a collaborative project to create a free editable map of the world.
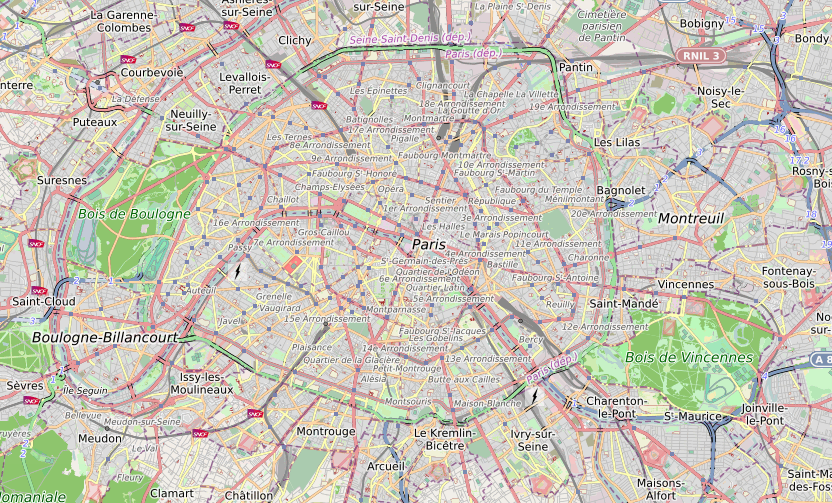
This vector (opens new window) data is structured according different categories (buildings, landuse, etc.). They are available in different styles (e.g. bright, dark, topography). Data is generated by OpenMapTiles (opens new window).
# BD ORTHO/ORTHO HR
BD ORTHO (Base de Données Orthophotographique) and ORTHO HR (Orthophotographie Haute Résolution) are both a collection of orthoimages (opens new window), geometrically corrected ("orthorectified") such that the scale is uniform across the covered area.
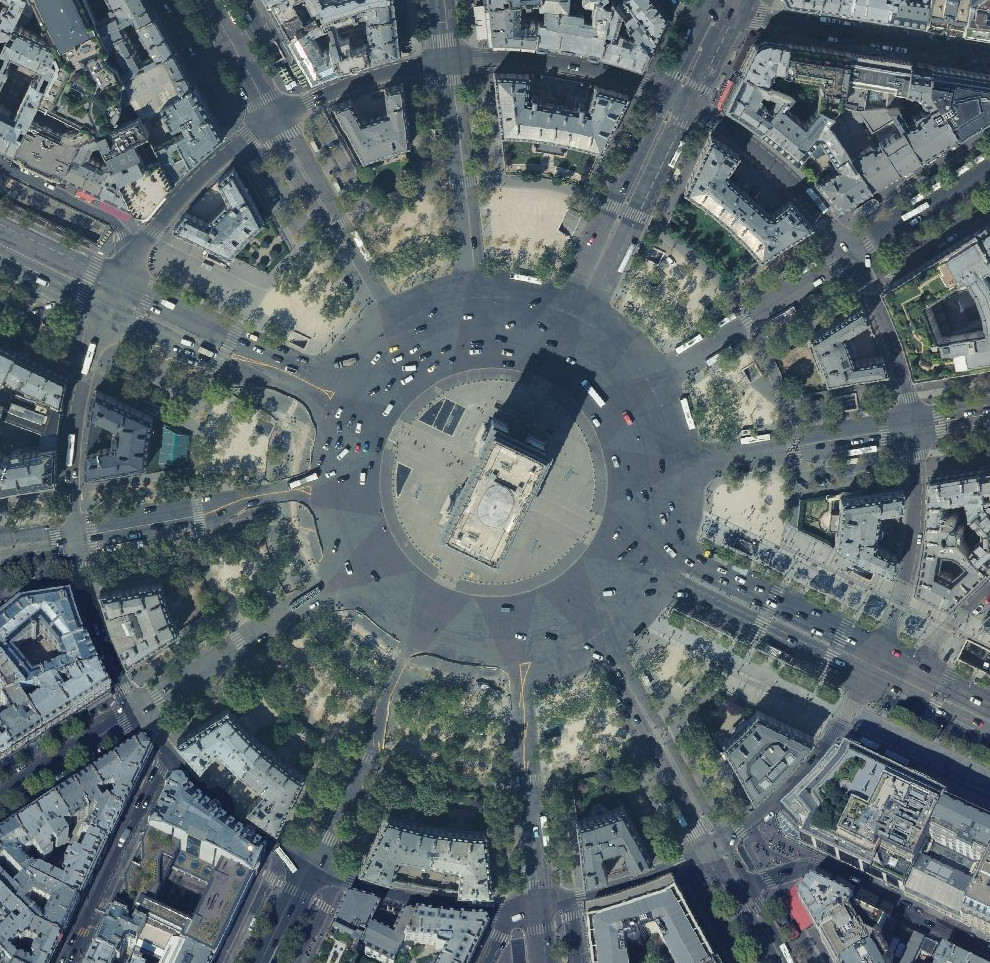
Those raster (opens new window) datasets are available with a resolution of 50 centimeters per pixel for BD ORTHO and 20 centimeters per pixel for ORTHO HR. The Institut national de l'information géographique et forestière (IGN) (opens new window) produces those datasets and they both are available under open license at this address (opens new window).
# PlanetSAT
The PlanetSAT dataset is a collection of orthoimages (opens new window). Those images are the result of specific processing on data produced by the Sentinel-2 (opens new window) and Landsat-8 (opens new window) earth observation missions. The dataset is available with a resolution of 10 meters per pixel.
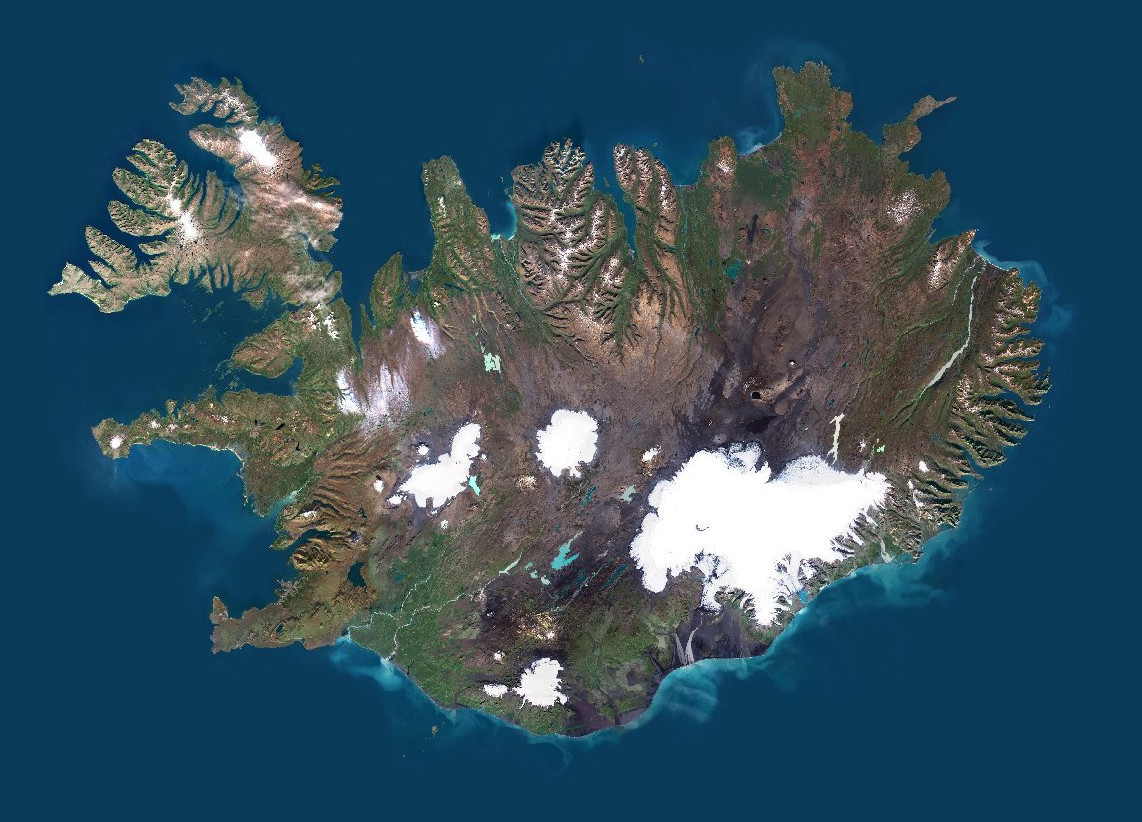
PlanetObserver (opens new window) produces this dataset.
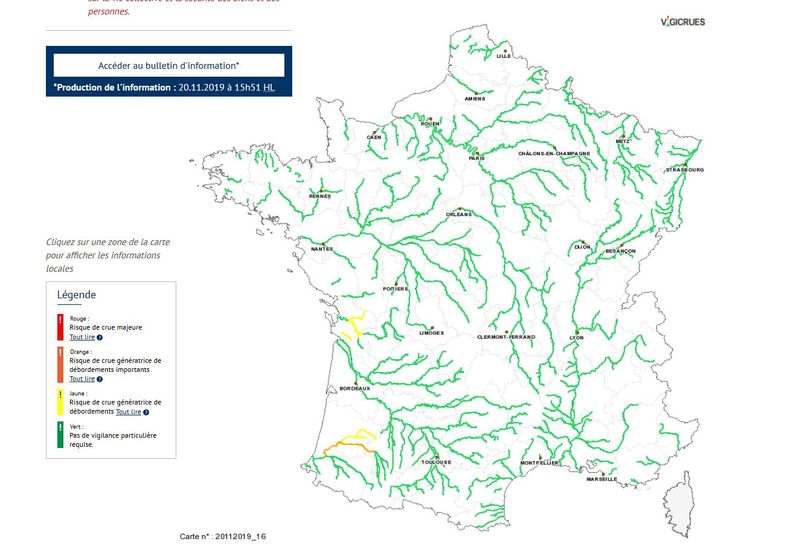
# Vigicrues
Flood warnings from the Vigicrues (opens new window) service.
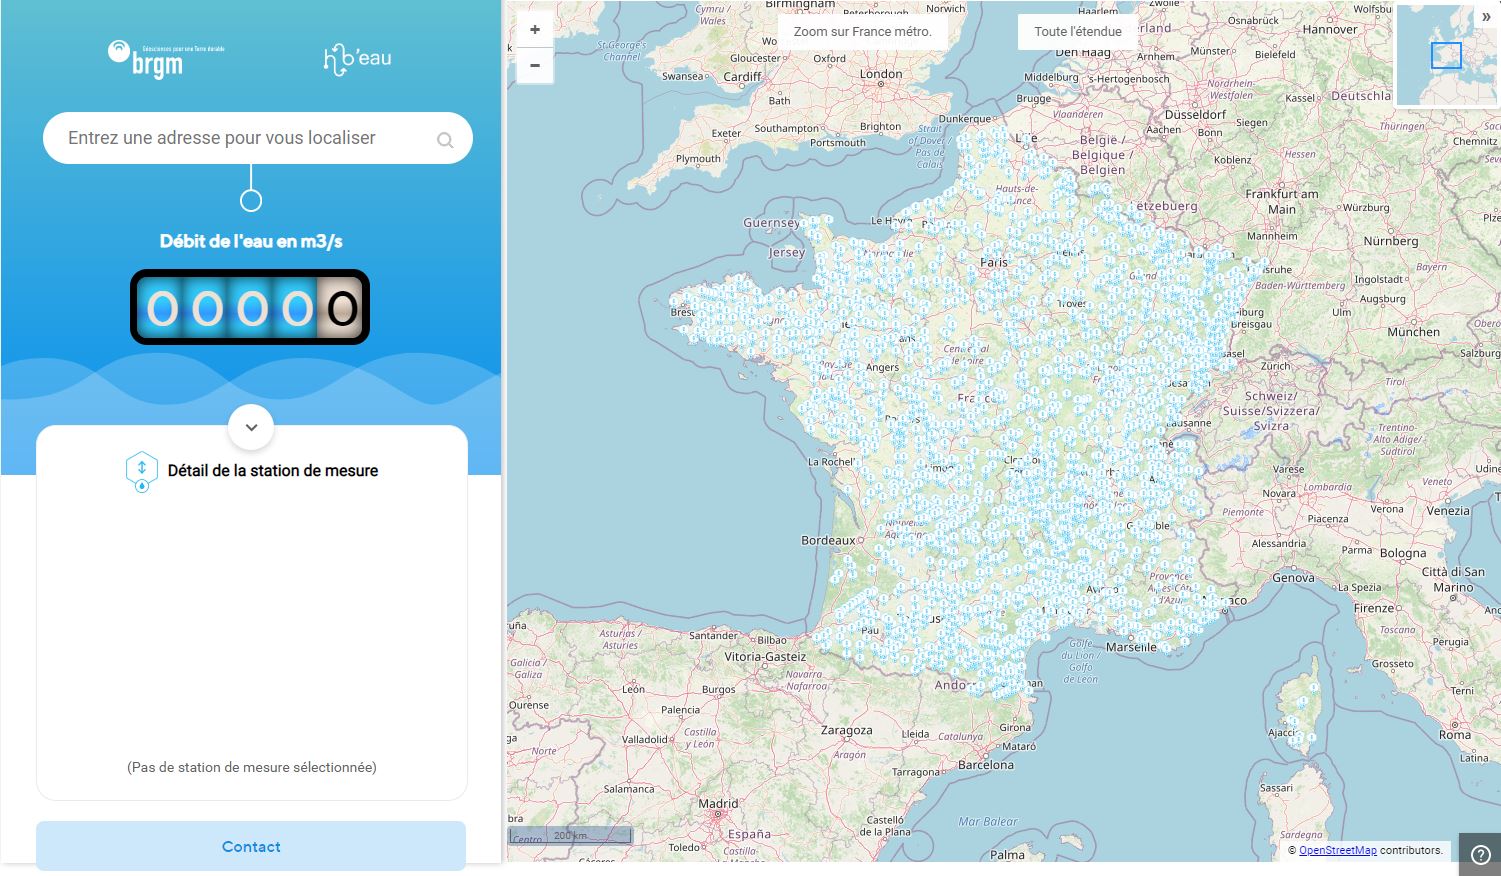
# Hub'Eau
Hydrometric data from the Hub'Eau (opens new window) portal.
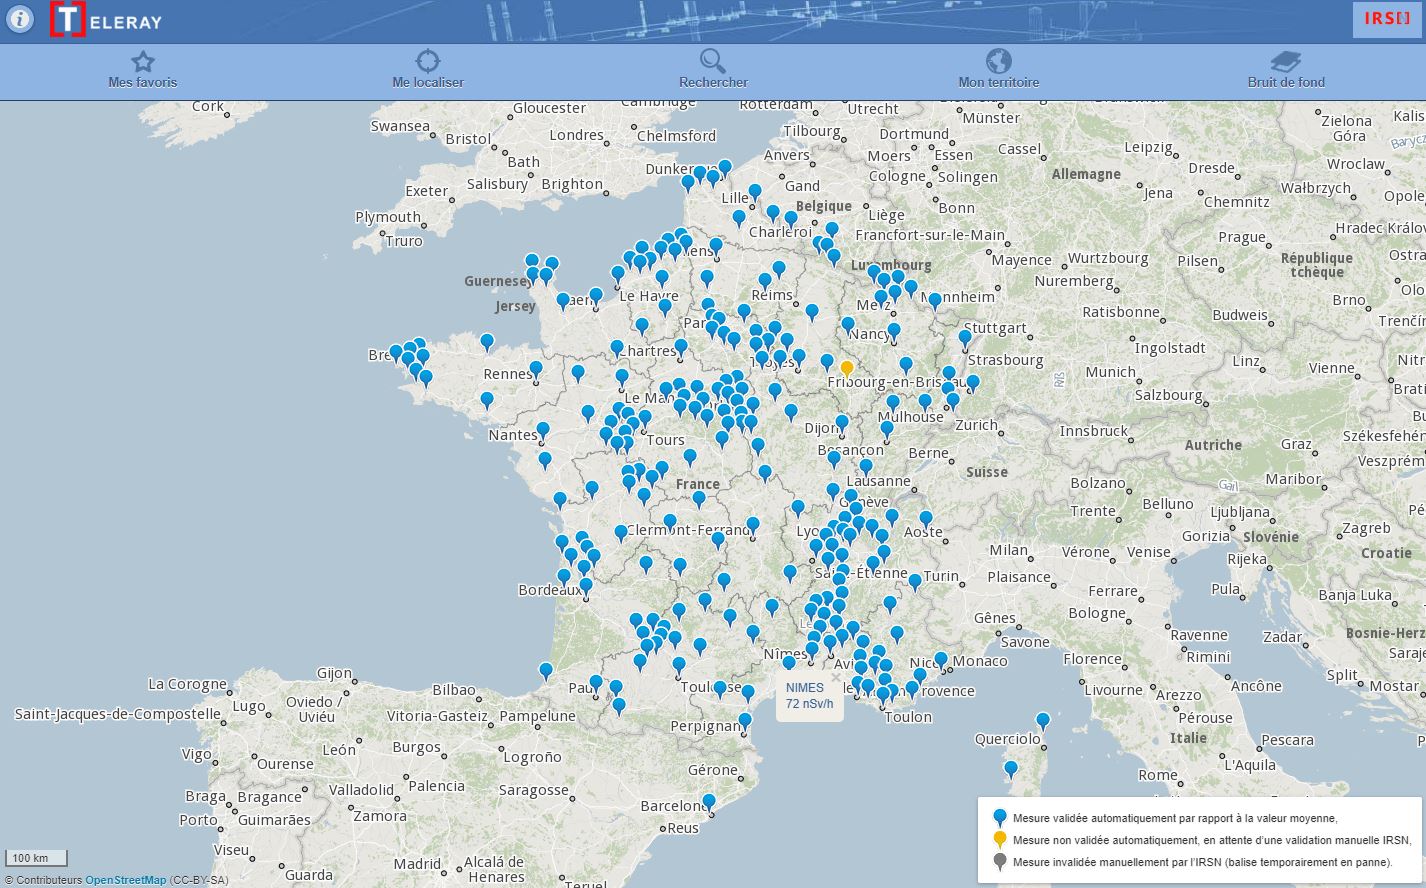
# Téléray
Ambient radioactivity measures from the Réseau national de télémesure Téléray (opens new window).
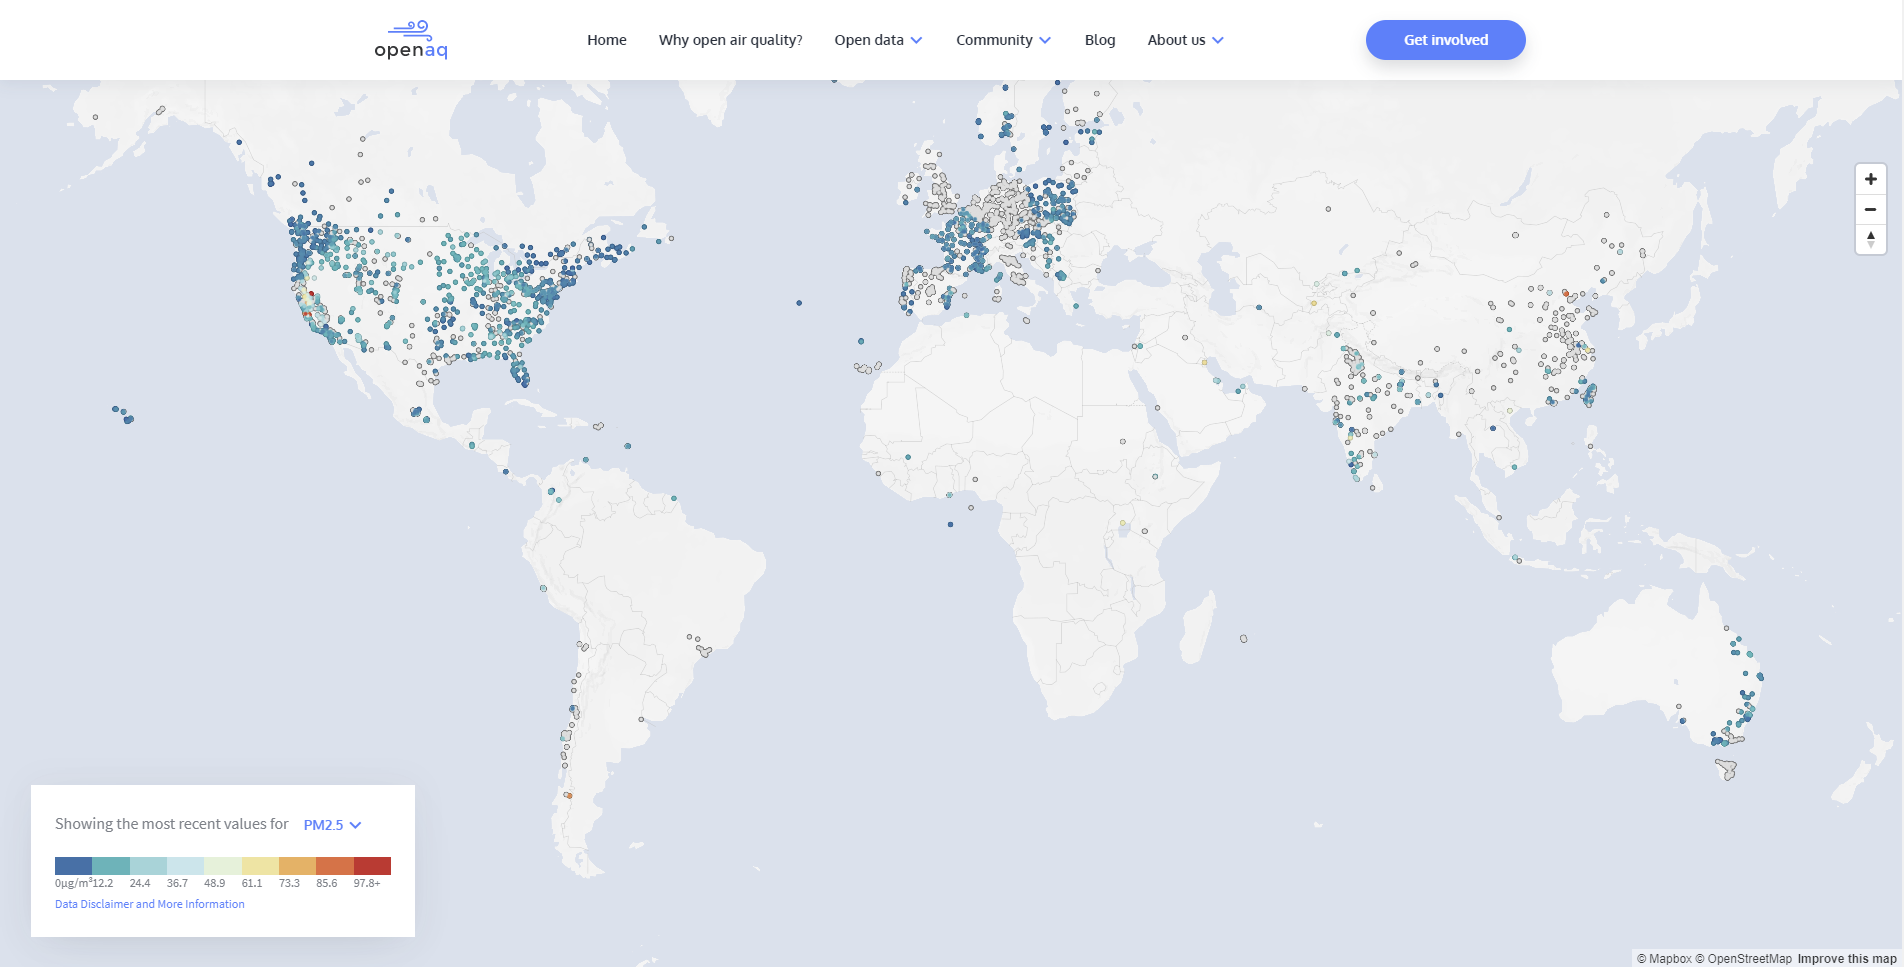
# OpenAQ
Air quality data collected in 93 different countries by the OpenAQ (opens new window) non-profit organization. It aggregates PM2.5, PM10, ozone (O3), sulfur dioxide (SO2), nitrogen dioxide (NO2), carbon monoxide (CO), and black carbon (BC) from real-time government and research grade sources.
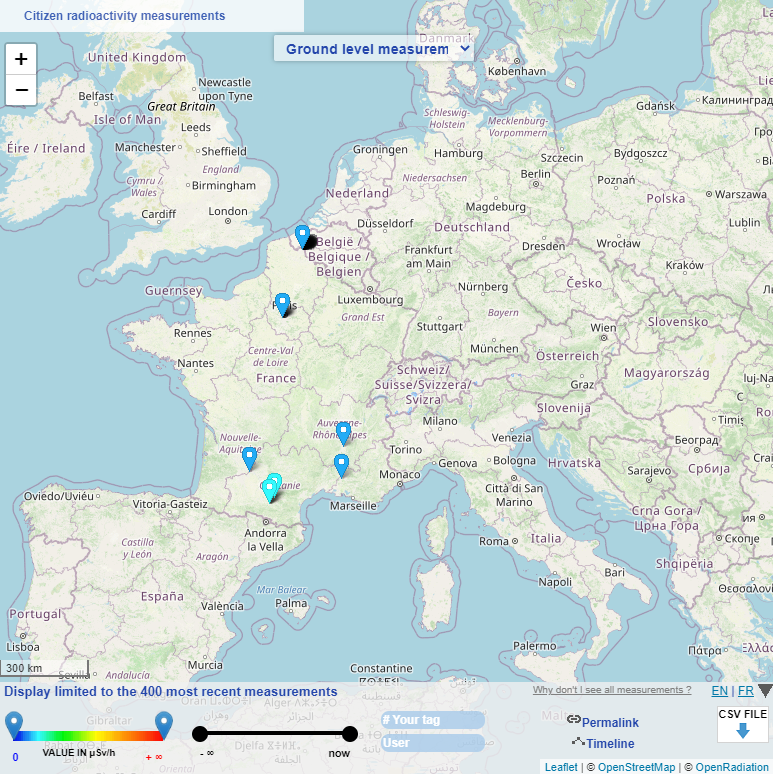
# OpenRadiation
The OpenRadiation (opens new window) project aims to centralize environmental radioactivity measurements by citizens, both in France and worldwide. It allow all users to capture measurements using various kind of dosimeters and exploit these measurements through various tools.
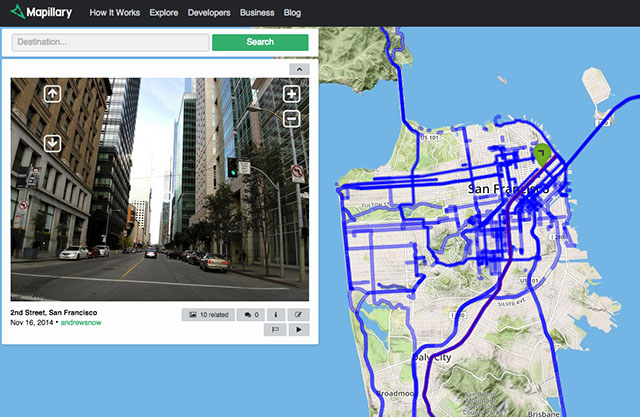
# Mapillary
Crowdsourced geotagged photos database from Mapillary (opens new window) platform.
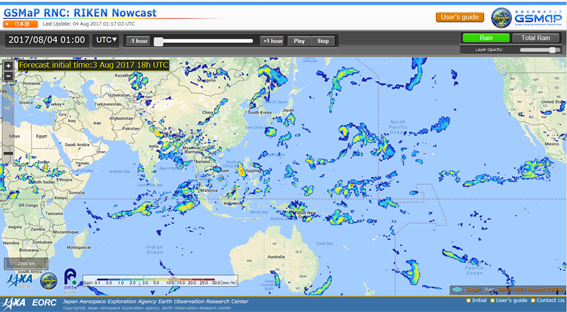
# GSMaP
Global Precipitation Measurement (GPM) is a joint mission between different space agencies to make observations of Earth's precipitations.
# Weather prediction
Available meteorological elements are the following:
- wind speed (m/s) and direction (°) at 10m,
- gust at 2m (m/s),
- temperature at 2m (°C),
- cumulated ground precipitations (rain and snow) over 3h (mm/h).
Data are gathered from different numerical weather prediction models detailed hereafter.
ARPEGE (Action de Recherche Petite Echelle Grande Echelle), which is an essential tool for operational weather forecasting at Météo France. Four daily forecasts are made at 0, 6, 12 and 18h UTC, with forecasting time of 102h, 72h, 114h and 60h respectively. Model forecasts are interpolated on a regular lat/lon grids, with one 0.1°x0.1° grid over the Europe-Atlantic domain and one 0.25°x0.25° grid over the Earth.
AROME, operational at Météo-France since December 2008, which was designed to improve short range forecasts of severe events such as intense Mediterranean precipitations (Cévenole events), severe storms, fog, urban heat during heat waves. Five daily forecasts are made with AROME, thus helping to better predict meteorological events of the day and of the morrow (42h forecast range). The size of the mesh, many time smaller than previous models, is 1.3km against 7.5km for ARPEGE over France.
Global Forecast System (GFS) is a weather forecast model produced by the National Centers for Environmental Prediction (NCEP), are also available. The entire globe is covered by the GFS at a base horizontal resolution of 18 miles (28 kilometers) between grid points, which is used by the operational forecasters who predict weather out to 16 days in the future.
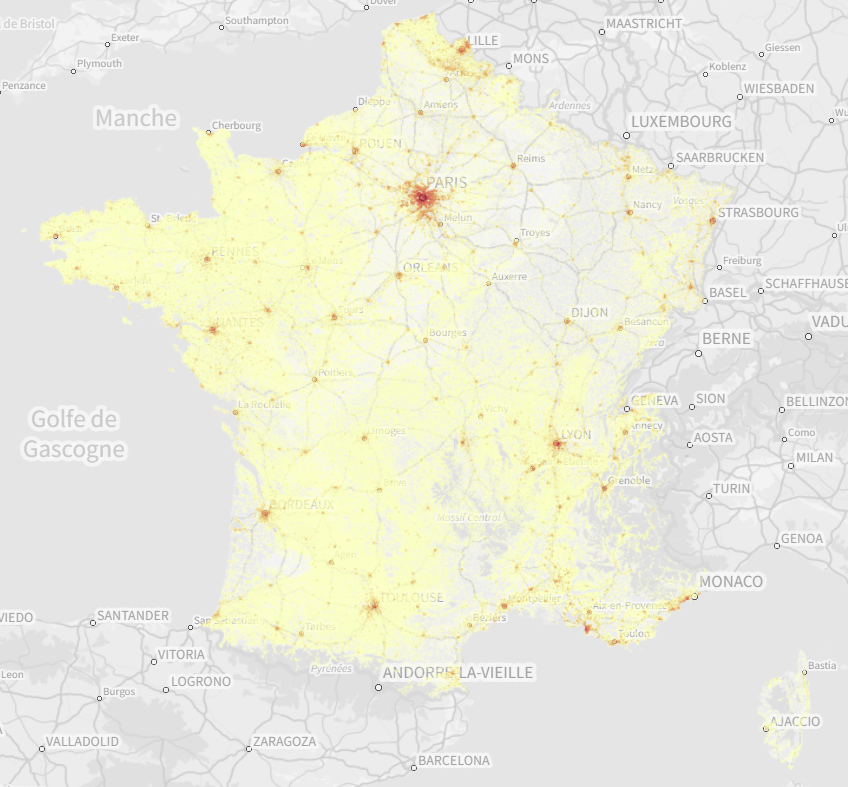
# Demography
Based on FiLoSoFi (opens new window) data from the Institut national de la statistique et des études économiques (INSEE), we provide demography information like the number of inhabitants per km² (i.e. population density) or the number of inhabitants per age and tile (1km or 200m).
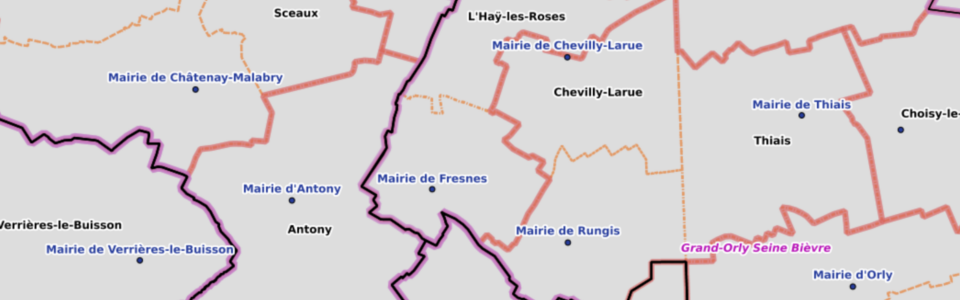
# Administrative boundaries
ADMIN EXPRESS (opens new window), produced by IGN, provide the French administrative levels (town, departement, region...).
# Components
Each component can be shown/hidden through a handle on the different side of the view:
- at the top to open the navigation bar,
- at the bottom to open the timeline,
- on the right to open the catalog panel.
In addition, a floating action button is available in the bottom-right corner to perform some actions.
👉 You manage an organisation ? Browse the catalog activity components
See also
How to enter the catalog activity from the dashboard
How to display the dashboard from the main menu
# Navigation bar
The navigation bar allows to quickly execute recurring actions:
- center the view on your current location,
- seek for an address,
- list and create your favorite views,
- display the coordinates of a location,
- switch to fullscreen mode.
👉 Launch the activity tutorial then open the link to the navigation bar tutorial to get more details
# Catalog panel
The catalog panel allows to manage the layers displayed on your map. You can show/hide a layer by selecting it in the relevant category.
WARNING
The data of some layers are only visible starting from a given scale if there is too much data to ensure a readable and smvisualisation.
In this case the layer will be disable until you reach the required scale on the map (zoom in or zoom to the layer to do so).
Using the menu on a layer you can access available actions for this layer.
👉 Launch the activity tutorial then open the link to the catalog panel tutorial to get more details
# Timeline
The timeline allows to quickly execute actions related to the time of the displayed data. Stick to real-time or go forward (i.e. forecast)/backward (i.e. history) in time as you wish.
👉 Launch the activity tutorial then open the link to the timeline tutorial to get more details
# Floating action button
Using the FAB you can:
- Create a new blank data layer:
- By connecting to web mapping services using OGC standards (WMS, WFS, TMS, WMTS).
- By locating and drawing the underlying entities. You can add the data schema from a JSON schema (opens new window) file in order to edit the meatadata (i.e. properties) of your entities.
- By import existing data from a GeoJSON (opens new window) file.
- Probe weather forecast data from active prediction models by selecting a specific location on the map.
👉 Launch the activity tutorial then open the link to the FAB tutorial to get more details
# Contextual menu
A right-click or a prologed touch on the map or on a feature will display a contextual menu with an action to create an event at this specific location or based on its geometry.
If the target feature comes from a measure layer or you right-click on a location of the map after activating a weather data layer (e.g. wind) you can also setup an alert.
Last but not least, it's possible to perform a population analysis on a polygon element. This analysys allow to compute the number of inhabitants, per age, possibly impacted by an event in the zone.
# Layer actions
Depending on the layer different actions are available. The most common action is to zoom to the layer in order to fit the view on the available data. If the layer is disabled at high scales this action will set the current scale of the map so that data will start be visible if the layer is shown.
More actions are available on user-defined feature layers:
- save the layer (i.e. make it persistent),
- edit layer properties like its name or description,
- edit layer features (metadata and geometry),
- edit display style,
- filter data according to metadata,
- display raw data,
- create charts,
- delete the layer.